| <!DOCTYPE html> |
| <html lang="en"> |
| <head> |
| <meta charset="UTF-8"> |
| <title>Echarts</title> |
| <script type="text/javascript" src="https://cdnjs.cloudflare.com/ajax/libs/jquery/3.1.1/jquery.min.js"></script> |
| <script src="https://cdnjs.cloudflare.com/ajax/libs/echarts/4.1.0/echarts.min.js"></script> |
| <script type="text/javascript"> |
| $(function () { |
| showChart(); |
| }); |
| function showChart() { |
| let chart = echarts.init(document.getElementById("chartDiv")); |
| let option = { |
| title: { |
| left: 'center', |
| subtext: 'DC: HLKH', |
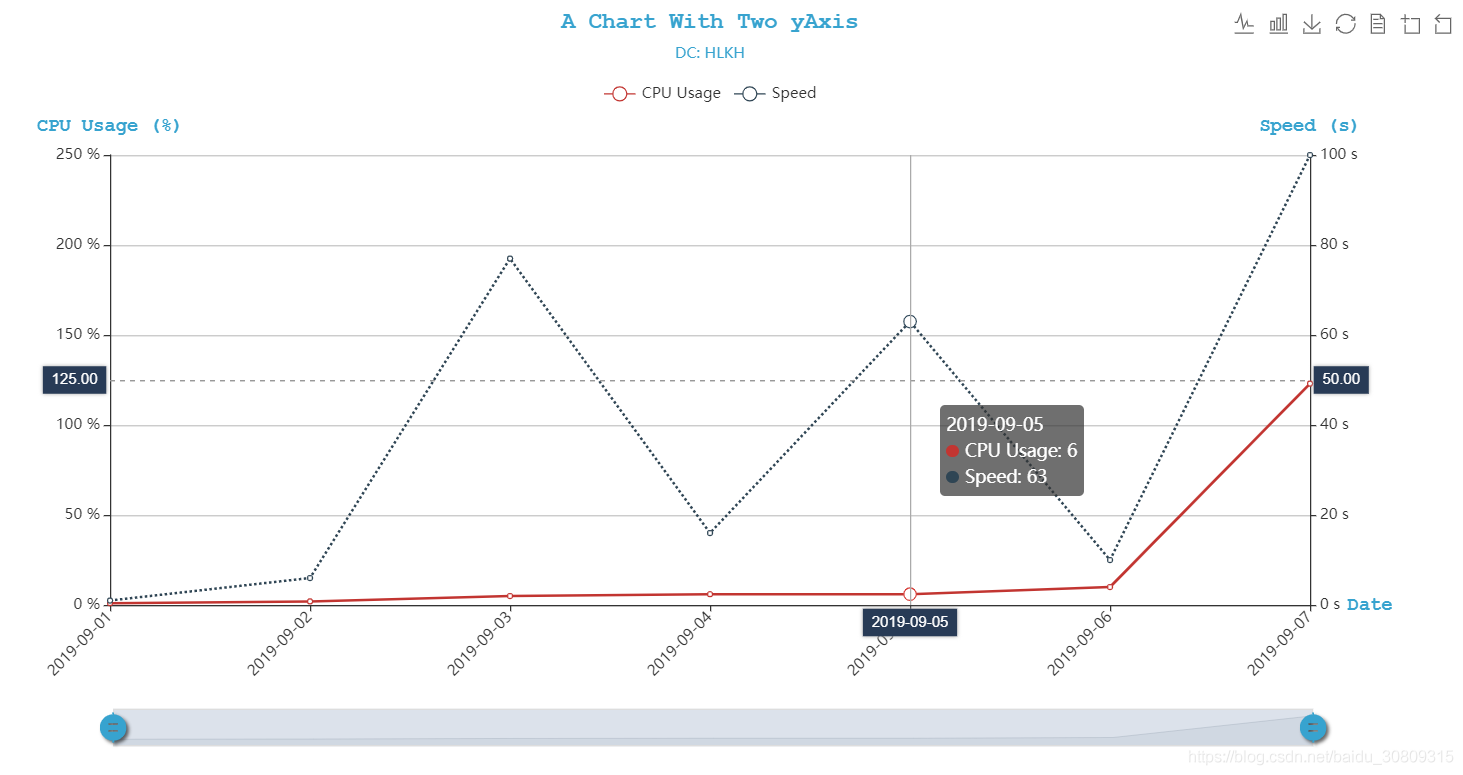
| text: 'A Chart With Two yAxis', |
| textStyle: { |
| color: '#37a3cf', |
| fontFamily: 'Courier New', |
| textShadowColor: 'blue' |
| }, |
| subtextStyle: { |
| color: '#37a3cf' |
| } |
| }, |
| grid: { |
| top: '20%', |
| bottom: '20%' |
| }, |
| tooltip: { |
| trigger: 'axis', |
| axisPointer: { |
| type: 'cross', |
| label: { |
| backgroundColor: '#283b56' |
| } |
| } |
| }, |
| legend: { |
| top: '10%', |
| data: ['CPU Usage', 'Speed'] |
| }, |
| toolbox: { |
| feature: { |
| magicType: { |
| show: true, |
| type: ['line', 'bar'], |
| title: { |
| line: 'line chart', |
| bar: 'bar chart' |
| } |
| }, |
| saveAsImage: { |
| show: true, |
| title: 'save as image' |
| }, |
| restore: { |
| show: true, |
| title: 'restore' |
| }, |
| dataView: { |
| show: true, |
| title: 'data view', |
| lang: ['data view', 'close', 'refresh'], |
| backgroundColor: '#37a3cf' |
| }, |
| dataZoom: { |
| show: true, |
| title: { |
| zoom: 'zoom in area', |
| back: 'restore zoom' |
| } |
| } |
| }, |
| x: 'right' |
| }, |
| dataZoom: [{ |
| type: 'inside', |
| start: 0, |
| end: 100 |
| }, { |
| start: 0, |
| end: 10, |
| handleIcon: 'M10.7,11.9v-1.3H9.3v1.3c-4.9,0.3-8.8,4.4-8.8,9.4c0,5,3.9,9.1,8.8,9.4v1.3h1.3v-1.3c4.9-0.3,8.8-4.4,8.8-9.4C19.5,16.3,15.6,12.2,10.7,11.9z M13.3,24.4H6.7V23h6.6V24.4z M13.3,19.6H6.7v-1.4h6.6V19.6z', |
| handleSize: '80%', |
| handleStyle: { |
| color: '#37a3cf', |
| shadowBlur: 3, |
| shadowColor: 'rgba(0, 0, 0, 0.6)', |
| shadowOffsetX: 2, |
| shadowOffsetY: 2 |
| } |
| }], |
| xAxis: [ |
| { |
| type: 'category', |
| name: "Date", |
| nameGap: 30, |
| nameTextStyle: { |
| color: '#37a3cf', |
| fontWeight: 'bold', |
| fontFamily: 'Courier New', |
| fontSize: 15 |
| }, |
| boundaryGap: false, |
| axisLabel: { |
| interval: 0, |
| rotate: 45 |
| }, |
| data: ['2019-09-01', '2019-09-02', '2019-09-03', '2019-09-04', |
| '2019-09-05', '2019-09-06', '2019-09-07'] |
| } |
| ], |
| yAxis: [ |
| { |
| type: 'value', |
| name: 'CPU Usage (%)', |
| axisLabel: { |
| formatter: '{value} %' |
| }, |
| nameTextStyle: { |
| color: '#37a3cf', |
| fontWeight: 'bold', |
| fontFamily: 'Courier New', |
| fontSize: 15 |
| }, |
| boundaryGap: [0, '100%'] |
| }, |
| { |
| type: 'value', |
| name: 'Speed (s)', |
| max: 100, |
| min: 0, |
| axisLabel: { |
| formatter: '{value} s' |
| }, |
| nameTextStyle: { |
| color: '#37a3cf', |
| fontWeight: 'bold', |
| fontFamily: 'Courier New', |
| fontSize: 15 |
| }, |
| boundaryGap: [0, '100%'] |
| } |
| ], |
| series: [ |
| { |
| name: 'CPU Usage', |
| type: 'line', |
| smooth: false, |
| yAxisIndex: 0, |
| data: [1, 2, 5, 6, 6, 10, 123] |
| }, |
| { |
| name: 'Speed', |
| type: 'line', |
| smooth: false, |
| yAxisIndex: 1, |
| itemStyle: { |
| normal: { |
| lineStyle: { |
| width: 2, |
| type: 'dotted' |
| } |
| } |
| }, |
| data: [1, 6, 77, 16, 63, 10, 100] |
| } |
| ] |
| }; |
| chart.setOption(option, true); |
| } |
| </script> |
| </head> |
| <body> |
| <div id="chartDiv" style="width: 1200px;height: 600px"></div> |
| </body> |
| </html> |